How to insert and position figures in Typst
Insert an image in Typst with #image("plot.svg"), and wrap it in #figure(…) to get a caption and a number. Attach a label with <fig:loss> after the figure and reference it with @fig:loss. Figures stay where you write them unless you pass placement.
#figure(
  image("plots/loss.svg", width: 80%),
  caption: [Training loss.],
) <fig:loss>

As @fig:loss shows, the loss decreases.
A complete document you can paste
#set page(paper: "a4", margin: 2.5cm)
#set figure(numbering: "1")

= Results

#figure(
  image("plots/loss.svg", width: 70%),
  caption: [Training loss over 50 epochs.],
  placement: top,
) <fig:loss>

Training converges by epoch 30, as @fig:loss shows.
Sizing
width and height accept a percentage of the available space or an absolute length. Percentages are usually what you want, since they survive a change of page size or margins.
#image("fig.svg", width: 80%)      // of the text width
#image("fig.svg", width: 8cm)      // absolute
#image("fig.svg", height: 4cm)     // constrain the other axis
#image("fig.svg", width: 100%, fit: "contain")
Placement
Unlike LaTeX, a Typst figure does not float by default — it sits exactly where you wrote it. placement: top, bottom, or auto opts into floating.
#figure(
  image("plots/loss.svg", width: 80%),
  caption: [Training loss.],
  placement: auto,      // top or bottom, whichever fits
) <fig:loss>
Captions above, and caption style
Tables conventionally caption above, figures below. Set it per document with a set rule.
#set figure(caption: (position: top))
#show figure.caption: set text(size: 9pt)
Two figures side by side
Nest figures in a grid. The inner figures carry their own captions and labels; the outer one supplies the shared number.
#figure(
  grid(
    columns: 2,
    gutter: 1em,
    figure(image("a.svg", width: 100%), caption: [Before.]) ,
    figure(image("b.svg", width: 100%), caption: [After.]) ,
  ),
  caption: [The effect of the correction.],
) <fig:pair>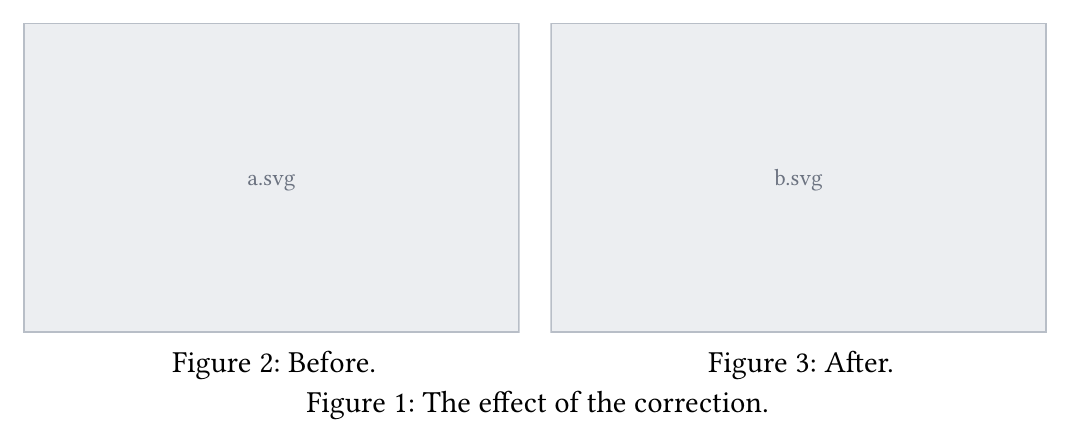
Drawing the plot in Typst instead of importing an image? See plots and bar charts in Typst. The full options are in the Typst figure reference.
width or placement shows the reflowed page right away instead of after a slow full compile.Common questions
- How do I insert an image in Typst?
- Call #image("path/to/file.svg") with the path relative to your document. Wrap it in #figure(...) when you want a caption and a number, and give the image a width such as width: 80% to size it.
- How do I make a figure float to the top of the page in Typst?
- Pass placement: top (or bottom, or auto) to #figure. Without it a figure stays exactly where you wrote it, which is the opposite of the LaTeX default.
- How do I put the caption above a figure in Typst?
- Use a show rule: #show figure.caption: set block(above: 0pt) is not enough on its own — set the caption position with #set figure(caption: (position: top)), which is the convention for tables.
- How do I put two figures side by side in Typst?
- Put two subfigures in a grid inside one outer figure. Each inner #figure gets its own caption and label, and the outer figure supplies the shared number.
- What image formats does Typst support?
- PNG, JPEG, GIF, SVG, and PDF. Use SVG or PDF for plots and diagrams so they stay sharp at any zoom, and raster formats only for photographs.